03 Products · Primary
ATAS
The order-flow platform: footprint and cluster charts on tick-level volume, with depth of market in its own data model. We build for it in native C# against its API, so our tools draw with the platform's own renderer.
Why
Lifetime access. Affordable. Always improving.
Every tool here is built for ATAS on its own data, not wrapped or emulated, and each one is coming to the ATAS Marketplace.
The standard is the same on every platform we ship to: lifetime access, affordable pricing, and product enhancements that keep coming.
We are committed to bringing premium, highly affordable indicators to the platforms you rely on most. We know the frustration of buying a tool only to feel stuck when the developer abandons it. That's why every indicator we offer comes with a guarantee of ongoing improvements. It's a one-time purchase for a lifetime of value—ensuring your edge in the markets remains razor-sharp.
Catalogue
021Reads the average price paid.
VWAP Suite
The VWAPs traders use, on one chart, with a record of what price has done at the VWAP and each band.
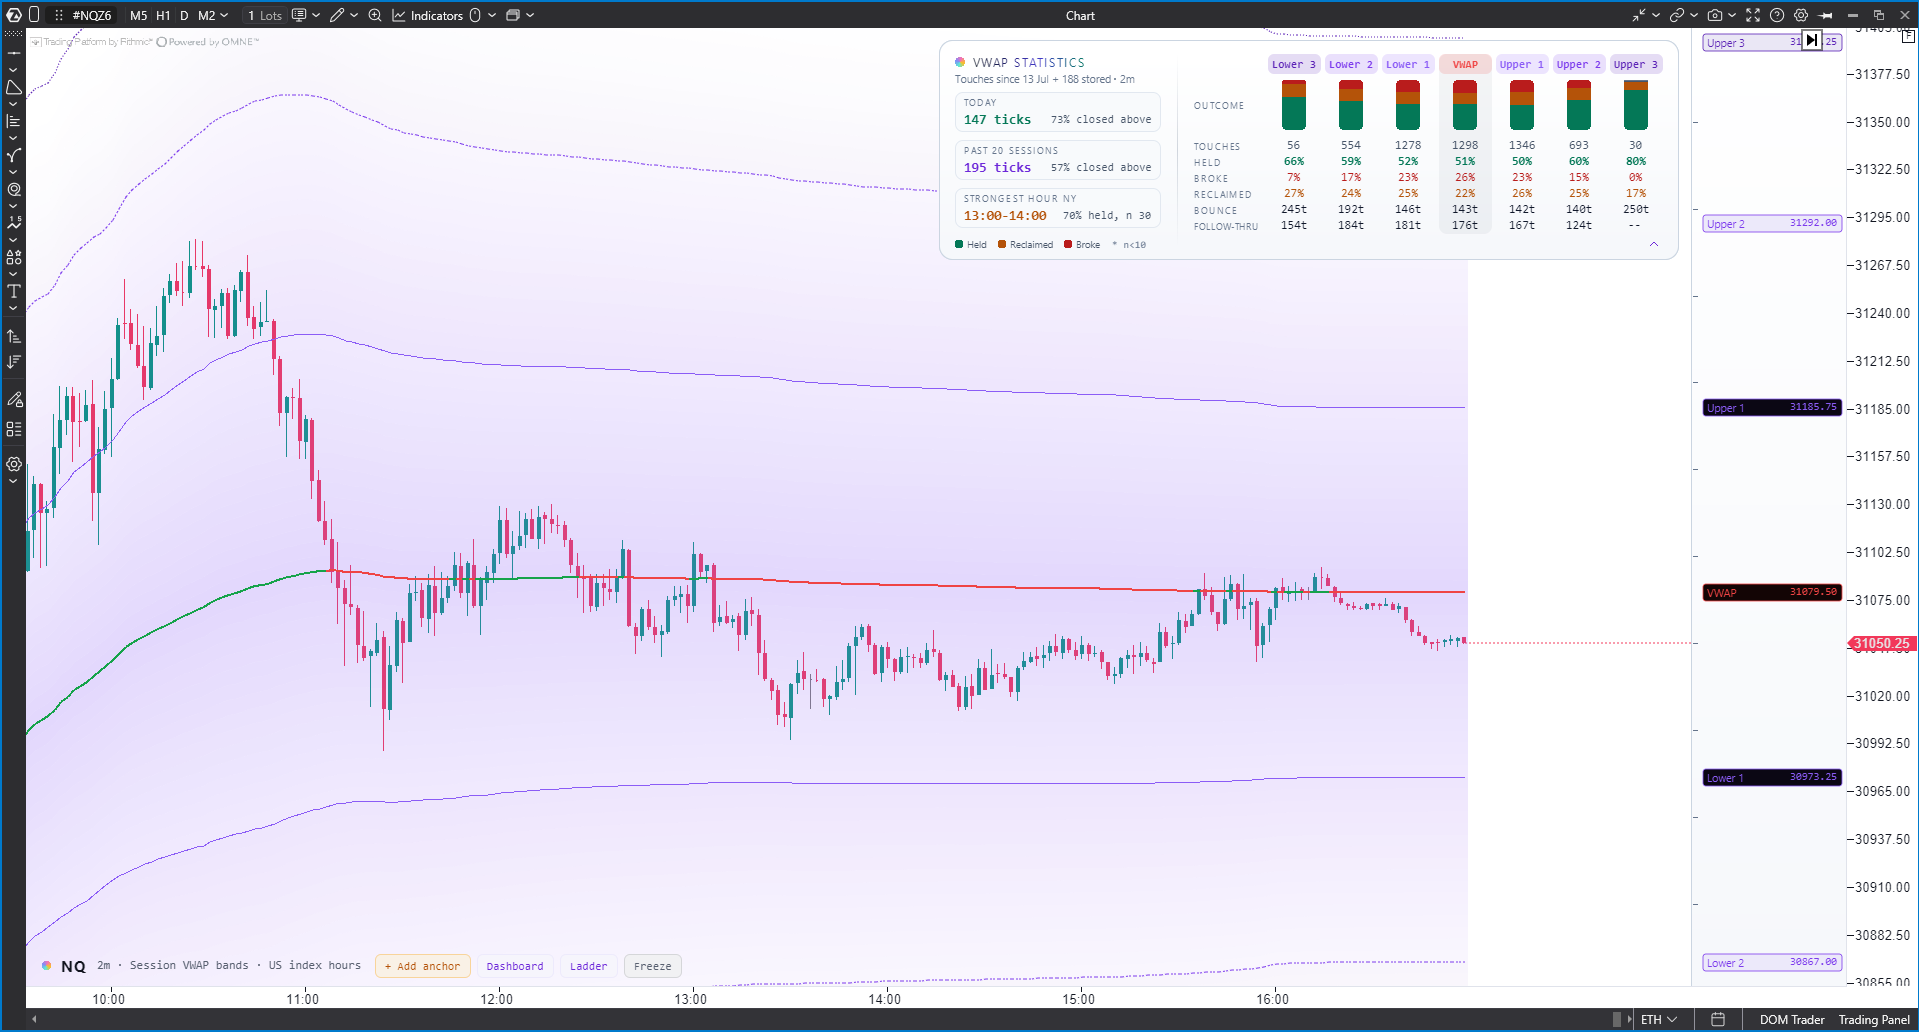
Session, calendar, rolling and anchored VWAPs on one chart, each with upper and lower bands, and each line reads the same on any chart type.
A statistics dashboard counts every touch of the VWAP and its bands and what followed, with the sample size beside each rate.
- 01 Many VWAPs, one chart Session, calendar, rolling and anchored VWAPs, each with its own upper and lower bands.
- 02 The record at every band Touches, held, broke, reclaimed, bounce and follow-through at the VWAP and each band, and the hour of the day it has held best.
- 03 Yesterday carried forward The prior session's VWAP, and any VWAP price has not returned to, stay on the chart as levels.
- 04 Freeze Stop any VWAP at a chosen bar and keep it on the chart as a fixed level; alerts keep working on it.
- 05 Alerts Crosses, slope turns, touches, band breaks and returns, and untested VWAPs.
- 06 Clean and readable The dashboard and price ladder hide with one click or fold to a single line, and the colours follow a light or dark chart.
- 07 Eight languages English, French, German, Italian, Korean, Portuguese, Russian and Spanish.
Minimum requirements · ATAS
- Data
- A data feed with real volume.
022The levels that matter, with their record.
Level Ledger
Every key level in one indicator, colour-coded by family, with how price has reacted at each.
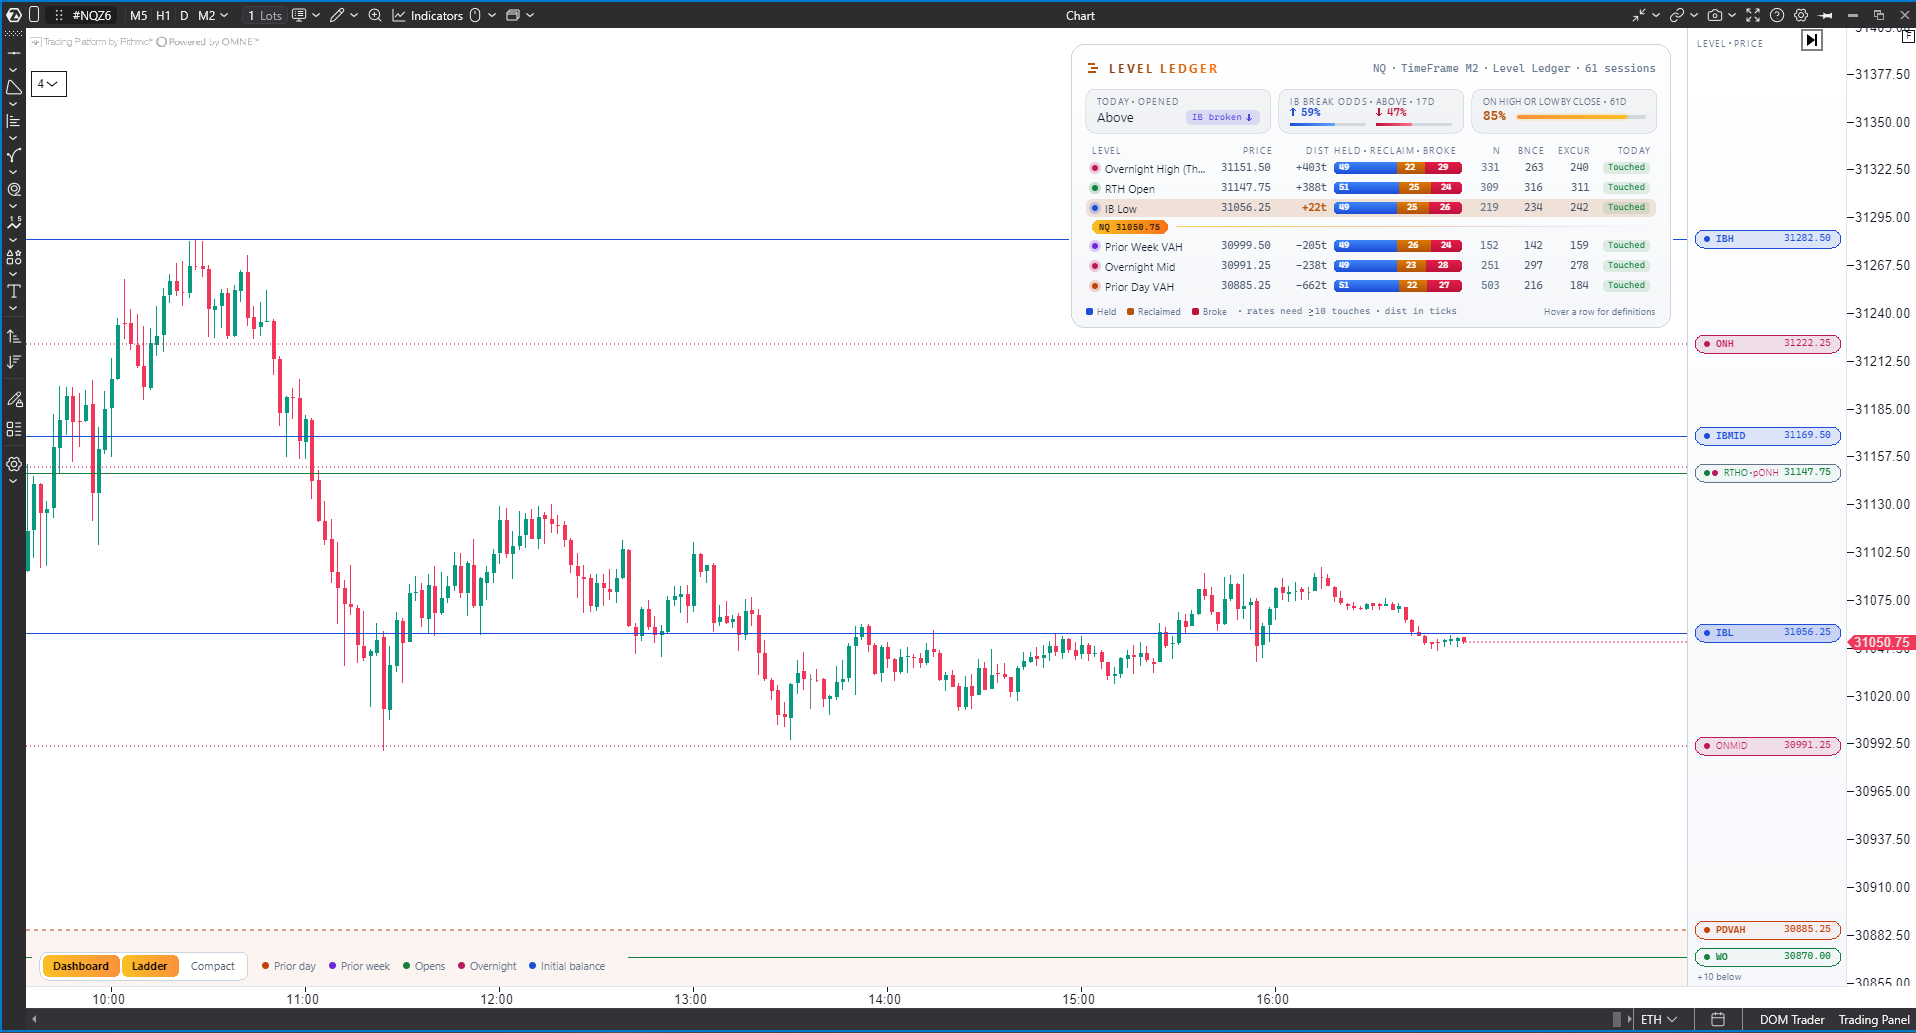
Yesterday's session, overnight, the initial balance, prior week and month, value areas, opens and more, drawn across the chart in one colour per family.
A ledger beside them records what price did at each level before, from up to seven years of the history you load.
- 01 All the levels, one indicator Yesterday's high, low, mid, open, close and value area, overnight, the initial balance and its extensions, opening ranges and gaps, sessions, prior week, month, quarter and year, composite value, pivots, settlement and expected range: 21 level families in 17 colours.
- 02 Colour by family Each family keeps one colour on the line, the label and the ledger, so you know what a line is at a glance.
- 03 The ledger Touches, held, broke, reclaimed, bounce and follow-through for each level nearest price, with the sample size beside every rate.
- 04 Chance today How often levels like the ones still untested today have been reached by the close, read from your own history.
- 05 Value your way Today's developing POC and value area drawn as a stepped path through the session, from the market profile or the volume profile, with prior value beside them.
- 06 Single prints Marked as they form in today's profile and carried forward until price trades back into them; a touched one stops where it was touched.
- 07 Up to seven years Statistics built in the background from up to seven years of loaded history, with the sample size always shown.
- 08 Light and dark The colours follow a light or dark chart, so nothing washes out.
- 09 Eight languages English, French, German, Italian, Korean, Portuguese, Russian and Spanish.
Minimum requirements · ATAS
- Data
- A data feed with real volume. The more history you load, the larger the sample behind each level's record.
014The higher-timeframe map.
Acorn
Your monthly, weekly and daily levels on one chart, with the hierarchy between them made obvious. A map, not a signal generator.
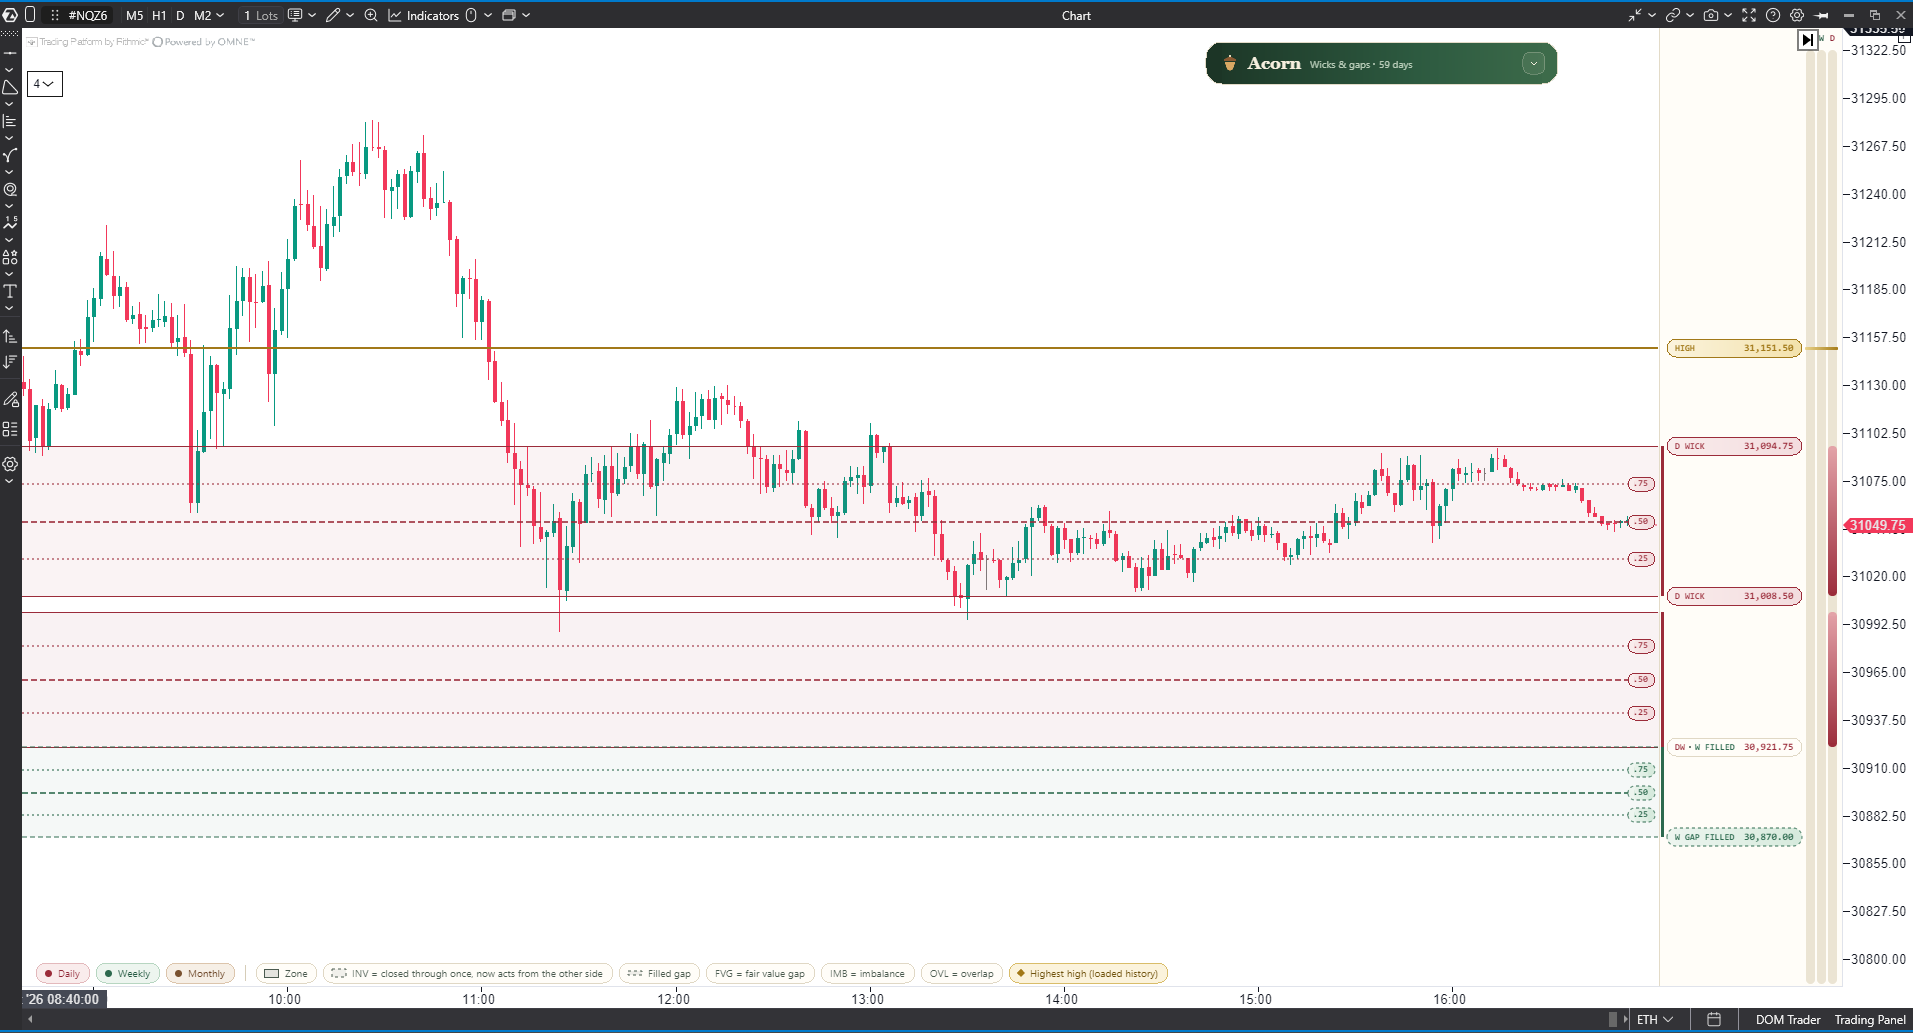
One clean view of which higher-timeframe level actually matters right now, and which lower one sits inside it.
The hierarchy is the whole point — no clutter, no signals, just the map.
- 01 The levels that rule See which higher-timeframe level you're really trading against.
- 02 Clear at a glance Each timeframe distinct, never colour-ambiguous.
- 03 A map, on purpose No signals and no blocks, just the map.
- 04 Narrow and clean Built to do one job and stay out of the way.
- 05 Eight languages English, French, German, Italian, Korean, Portuguese, Russian and Spanish.
Minimum requirements · ATAS
- Data
- None beyond a data feed: daily history from your feed builds the map. No order flow needed.
Licensing
Every ATAS product is a one-time purchase with a lifetime licence and continual updates at no additional cost. You buy from us, access goes to the email of your ATAS account, and the indicator and its updates download into ATAS for you.
Want to try one first? Each ATAS analysis engine comes with a seven-day free trial. Create your token in the members area with the email you sign in to ATAS with, then paste it into the indicator's Token setting.